Actually using the new DataConnector for PowerBI
After I’d written it – I realised my last post was perhaps not the most useful for those who really don’t care about the how but want to know what to do to use it. So this will follow the same deal as with the last post (over a year and a half ago!! WOW!).
Video version below if you want it:
The Setup Steps
First – we’ve got to install PowerBI – now, I didn’t sign up for an account, but downloaded it from the PowerBI website, and installing was simple and quick.
We also need to have Neo4j running, and you can use Community or Enterprise, it matters not – and we’ll want to put the ‘Movies’ dataset in there, so run your instance, and execute:
:play movies
Add the Data Connector to Power BI
1. First – download the connector from the releases page (or build it yourself in VS) – you want the `Neo4j.mez` file.
Version 1: https://github.com/cskardon/Neo4jDataConnectorForPowerBi/releases/tag/1.0.0
2. PowerBI looks for custom connectors in the <USER>\Documents\Power BI Desktop\Custom Connectors folder, which if it doesn’t exist – you’ll need to create. Once you have that folder, copy the Neo4j.mez connector there.
3. Nearly there – we just need to allow PowerBI to load the connector now – so, start up PowerBI and go to the Options dialog:
Once there, select the ‘Security’ option, and then under the Data Extensions header select the option allowing you to load any extension without validation or warning:
You’ll have to restart PowerBI to get the connector to be picked up – so go ahead and do that now!
Lets Get Some Data!
Now – I know a lot of you will have been excited by the Pie Chart from the last post – now you can create your own!
With a new instance of PowerBI running, let’s select ‘Get Data’
We can now either search for ‘Neo4j’ or look in the ‘Database’ types:

Select Neo4jthen press ‘Connect’ – aaaaand a warning!

Read it, ignore it – it’s up to you – but this is just to let you know that it’s still in Beta (I mean it’s only had one release so far!) Continue if you’re happy to.
Now you’re given the boxes to enter your Cypher and connection information – the text box for the Cypher field is a single line (ugh) – so if it’s a complicated query – you’re probably best of writing it in Sublime or similar (maybe even Notepad!?!). In this case, we can go simple:
MATCH (m:Movie) RETURN m;
Now, the other settings, if you’re running default settings – you can leave these, but obviously if you need to connect to https instead of http change it in the scheme setting. I’ve filled in my display with the defaults:

When you press OK, you get the Login dialog, if you are anonymously connecting, then select Anonymous, else – fill in your username / password.

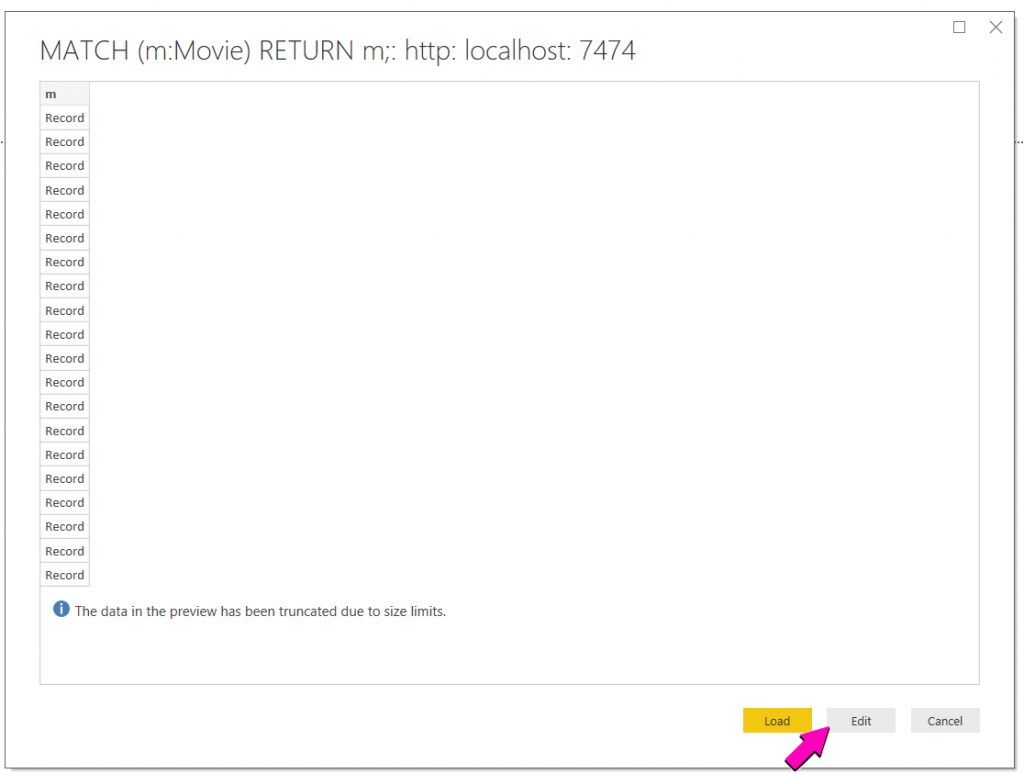
Press ‘Connect’, and PowerBI will connect to your DB and return you back a list of ‘Record’:

We’ll want to ‘Edit’ this, so press ‘Edit’!
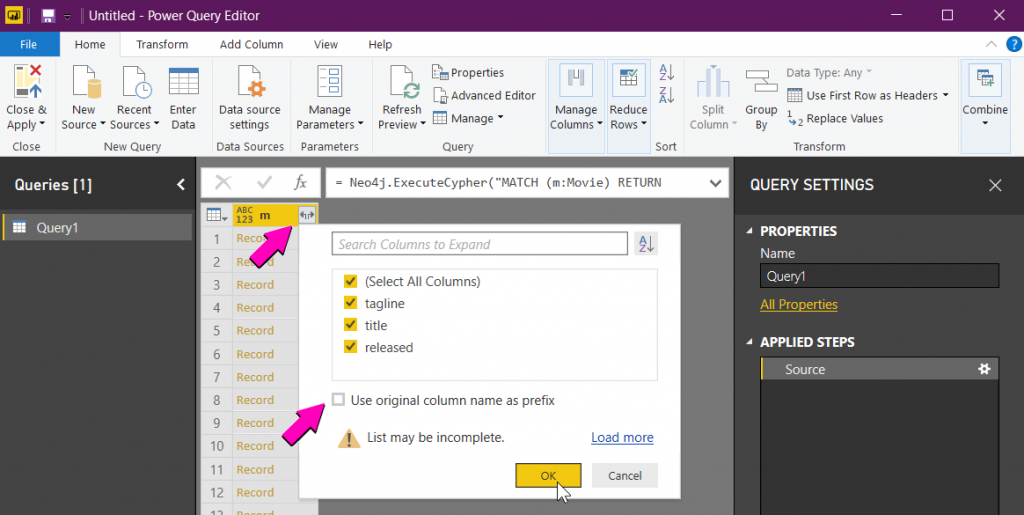
When the Power Query Editor opens press the expand column button at the top of the ‘m’ column:

Ooooooh, ‘tagline’, ‘title’ and ‘released’ — our movie properties! For this, I would turn off the ‘use original column name as prefix’ checkbox, leave them all selected and press OK.

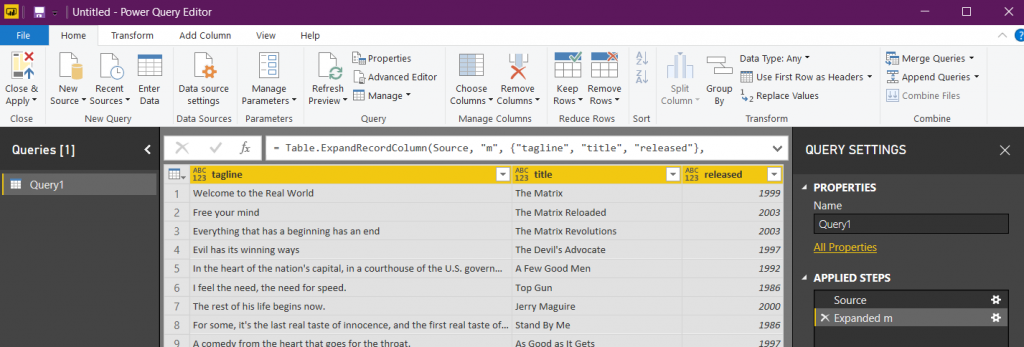
Data!!
Now, let’s ‘Close & Apply’ our query – NB – if you look in the ‘Applied Steps’ section, you can see we only have 2 steps, ‘Source’ and ‘Expanded m’

Whilst PowerBI applies it just think of the Pie charts that lie ahead of us:

When that dialog disappears, we’re good to go! On the right you’ll see a ‘Fields’ section, and you should see something like this:

So, the moment we’ve all waited for…
Let’s Pie Chart
Select ‘Pie Chart’ from the Visualizations section:

Once it’s in your display – select it and drag the ‘released’ field from the Query1 to the ‘details’ field, and then title to the ‘values’ field:

Your chart should look something like this now:

So let’s max size it, and mouse over it, now we can see:

But we can also drag ‘title’ on to the Tooltips field like so to get the First (or last) movie in that group:

What does a query look like under the covers?
Some of us like visual, some like code, the last time we tried this – our query was 20 lines long – our new query though – that’s just 5!
let
    Source = Neo4j.ExecuteCypher("MATCH (m:Movie) RETURN m;", "http", "localhost", 7474),
    #"Expanded m" = Table.ExpandRecordColumn(Source, "m", {"tagline", "title", "released"}, {"tagline", "title", "released"})
in
    #"Expanded m"
Which is much nicer.
Hey hey! It’s Beta!
The Data Connector approach gives a much nicer way to query the database, it strips out a lot of the code we have to write, and hopefully makes the querying easier.
BUT – I am not a PowerBI expert – is this the right way to do this? Are there improvements? Some hardcoded queries we should have there? Let me know – do a PR – it’s all good!


[…] I’ve written a Data Connector for Neo4j now – and I would heartily recommend you have a look at the new post I’ve written about it here: http://xclave.co.uk/2019/02/06/actually-using-the-new-dataconnector-for-powerbi/ […]
nice article
Working really well. Great Job.
The only limitation that is really sad is that this Data connect to Neo4j is not enabled for automatic refresh in Power BI.
When turning on Auto Scheduling for retrieving data in Power B you´ll get the following message:
You can’t schedule refresh for this dataset because the following data sources currently don’t support refresh:
Data source for Prod_Feedback
Data source for Prod_User
Discover Data Sources
Query contains unknown funtion name: Neo4j.ExecuteCypher.
I’ve added it as a bug to the github repo – and I’ll see if it’s possible to have refresh in it.
Thanks a ton for this, I was able to get the connection to work, and I’m going to do some further experimentation. So far so great!
Question for you… how would I get relationships to be represented, is that possible?
Hmmm, I’m not sure – you’re bumping into my limitations of knowledge here! I’ll see if I can work it out
OK, checked and yes – it works fine, let’s say the cypher was: MATCH (n)-[r]->(m) RETURN n,r,m – you’ll get the option to expand out the results in the same way as before – with ‘r’ being the properties on that relationship.
Hey, I followed the guide step by step, but when it starts loading data, I receive the following error:
Details: “Web.Contents failed to get contents from ‘http://localhost:7474/db/data/transaction/commit’ (415): Unsupported Media Type”
Any idea how to fix this?
What version of Neo4j are you using? Can you create an issue on the GitHub page with screenshots of the UI for the connection, and example queries if possible
I cannot seem to get this to work. I am pretty PowerBI fluent, but no matter what set of parameters, I get a variant on ‘http://tst.veriprism.net:7474/db/data/transaction/commit’ (415): Unsupported Media Type”
Tried, http, https (with 7473 of course). Neo 4.1 though. No local copy.
Hmmm, the URI isn’t a valid 4.1 URI, but I assume you have set the DB version to 4, could you open an issue on the GitHub page with screenshots of what your connection page looks like, and maybe an example type of query?
Hello! I was following your explanation and when connecting, the following error appeared ‘http://localhost:7474/db/data/transaction/commit’ (415): Unsupported Media Type”. Do you know what it is? Thank you very much!